As more and more Applications and workloads are being shifted to the Cloud, Enterprises are tasked with maintaining and operating these applications.
This is how Cisco SD-WAN Analytics with SD-WAN can help with increased visibility and insights for better control and troubleshooting issues a lot faster when they occur.
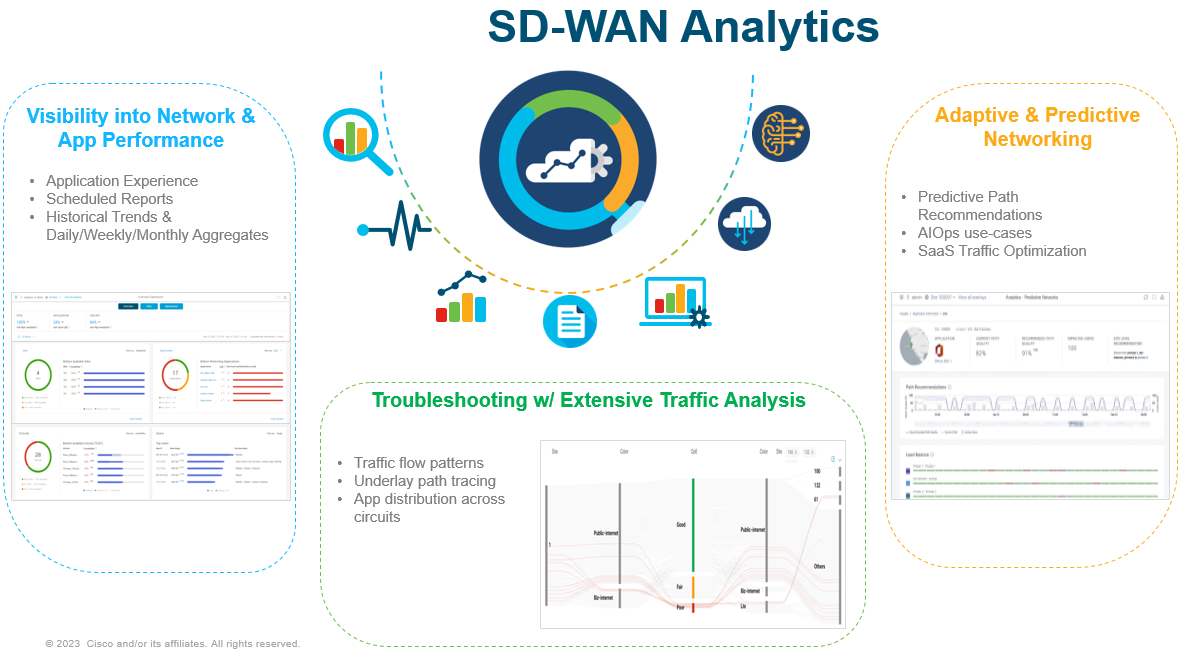
SD-WAN Analytics is broken into three pillars:
- Visibility
- Troubleshooting
- Predictive Networking

Edge routers send their data to SD-WAN Manager which in turn uses secure APIs to then transferred data to Analytics, Analytics is hoses in AWS Cloud.
Visibility
Summary Dashboard is the landing page/homepage when you login to Manager, this provides a quick snapshot of your entire application and network. This allows Enterprises to quickly access the health of their overall network and applications.
It is organised into 4 key widgets:
- Applications
- Sites
- Circuits
- Users
Each widget gives you the capability and displays the change in metric compared to the previous time period. The time period can be from 12 hours to 1 month. You can also choose to view data for up to 7 days in the past 3 months.

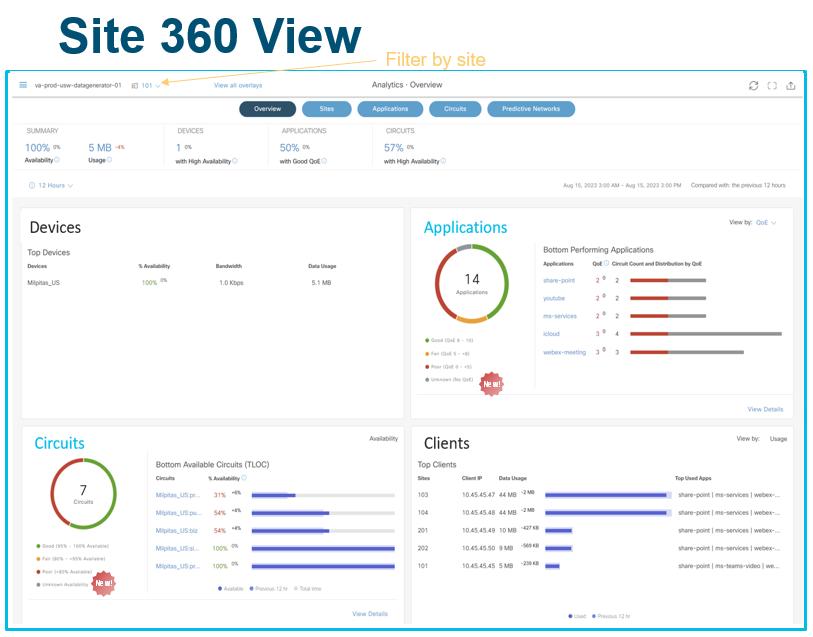
The summary image above allows the user to view a specific site instead of the whole of SD-WAN network. This allows the user to see what applications are being used, circuit health and the clients on the Service side VPN.

On the Applications Dashboard allows the user to view the application QoE with a score based on how well the application is performing.
1 – Application summary by QoE with health score and usage through the GUI, usage stats for Apps.
2 – Get an aggregated view into how a group of similar applications is performing.
3 – trending applications that is showing a drop or rise in QoE.
4 – Compare and analyse usage QoE across different apps over time
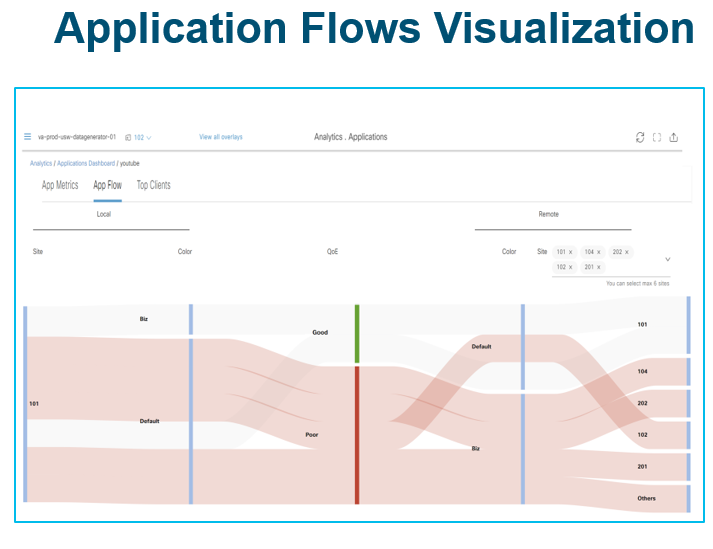
Visualisation diagram shows what are the top used remote sites for a specific application for a specific site. This also offers how traffic is being distributed by QoE and what Colours (Transport) is being used for that application.
Troubleshooting
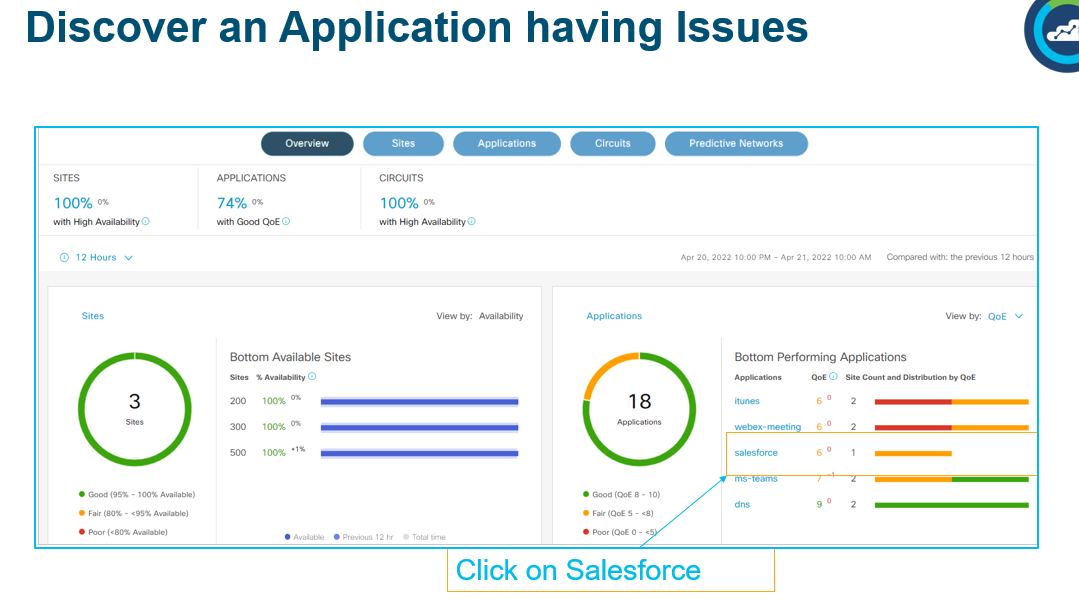
On the Dashboard Overview – you can view the bottom performing Applications. using SalesForce as an example.
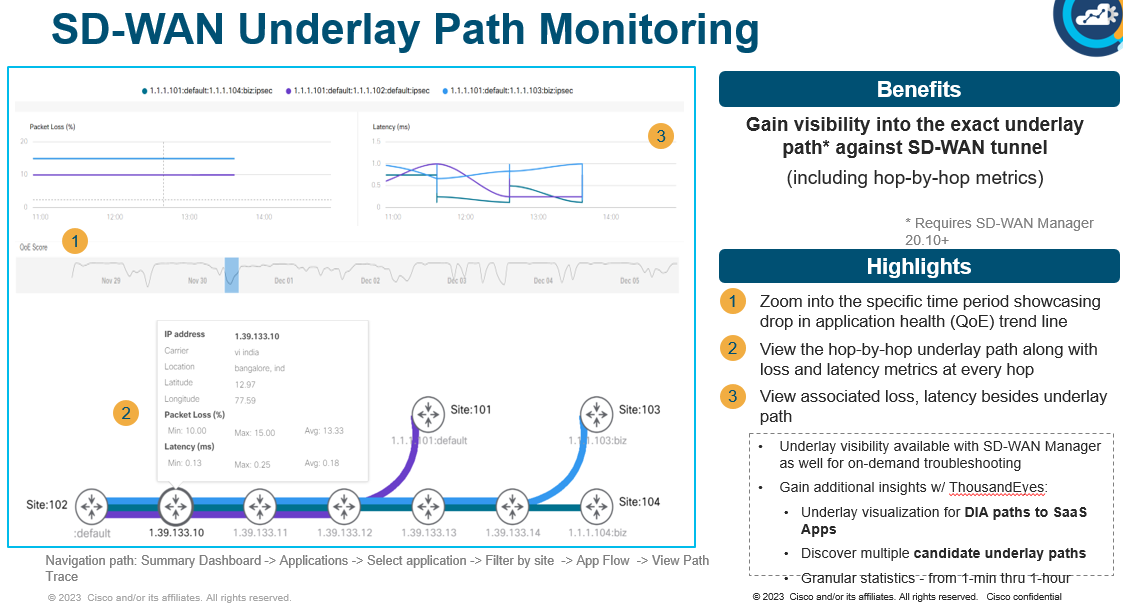
To gain further insights, you can utilise the SD-WAN Underlay Visibility feature that allows you to drill all the way down to the SD-WAN tunnel’s underlay path and view metrics such as loss and latency on a hop by hop basis. This capability will also be available on SD-WAN Manager on an on-demand basis while SD-WAN Analytics will offer a historical view of your underlay path.
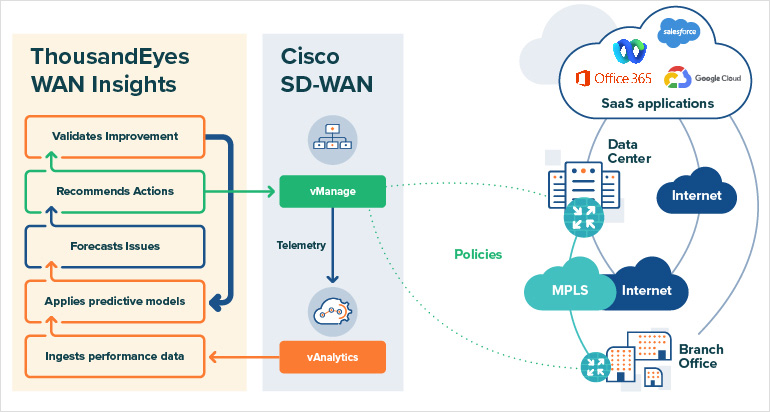
Predictive Insights/WAN Insights
This is a Cisco Product which is a close collaboration between SD-WAN Anaylytics and ThousandEyes. This is available on v20.12.x
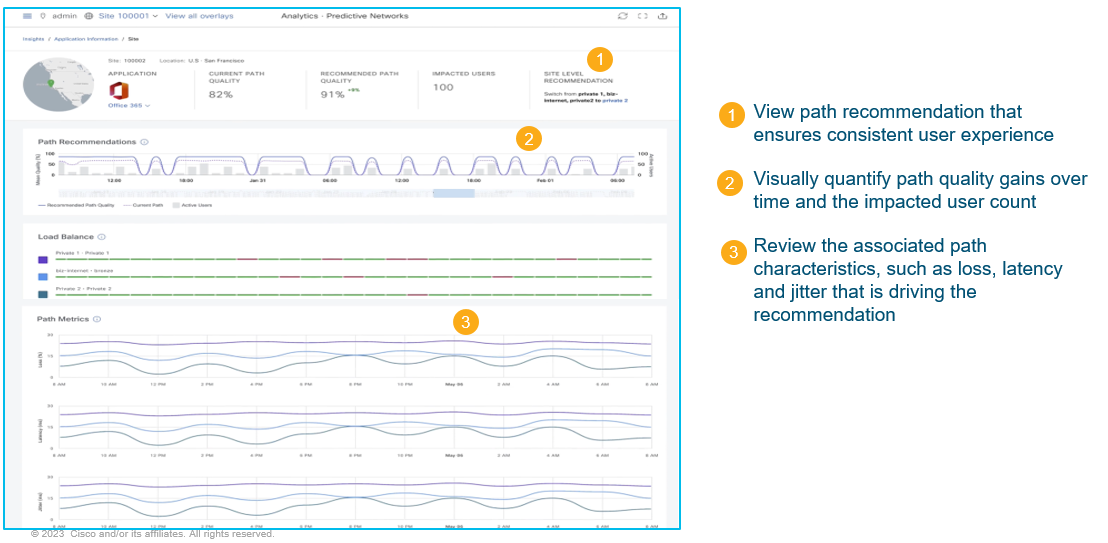
WAN Insights predicts path recommendation features, monitors network path performance over the historical time (minimum 24 hours), which is then applied with predictive daya modelling to it. Essentially forcasts likely issues in the future and makes appropriate recommendations for alternate network paths of applications.
Enterprises can then take advantage of these recommendations to fine-tune their SD-WAN policies to avoid any future performance issues which results in optimised application experience.

Forecase future WAN Bandwidth needs
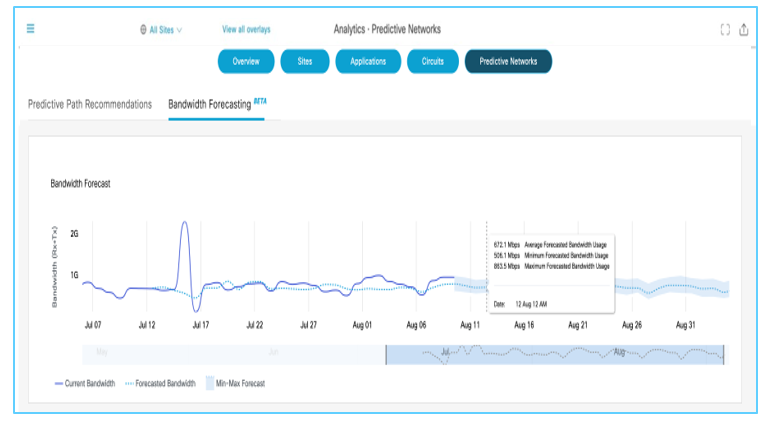
Using Artificial Inteligence and Machine Learning, you can forecase bandwidth usage. Dotted line is the forecasted bandwidth for a circuit, Solid line is the actual bandwidth of a circuit. This will be useful especially for MSPs or ISPs that is providing transports as well as SD-WAN managed Service.